
frame
Howdy, Stranger!
It looks like you're new here. If you want to get involved, click one of these buttons!
Sign In RegisterHowdy, Stranger!
It looks like you're new here. If you want to get involved, click one of these buttons!
Quick Links
Categories
- 1.3K All Categories
- 7.3K General
- 6.2K General Discussions
- 411 Feature Request/Bug Report
- 545 Sales Questions and Answers
- 54 Time4VPS Life
- 242 Help requests
- 244 Server management
- 379 Tutorials
- 68 Various Tutorials
- 61 Web hosting control panels
- 133 Performance and Security
- 29 Web Applications
- 63 Linux Applications
- 25 Windows VPS


Howdy, Stranger!
It looks like you've been lurking for a while.
If you register, we also will remember what you have read and notify you about new comments. You will also be able to participate in discussions.
So if you'd like to get involved, register for an account, it'll only take you a minute!
[Linux] Strace installation and usage
 Ievaz
Administrator
Ievaz
Administrator
Since some programs or tools might crash, or do not behave as expected, using strace may reveal that programs or tools are attempting to access a file that can't be read or even does not exist. Due to this reason, it's quite useful to start a program or tool using strace, which has the ability to print a list of system calls made by the tool or programs.
What is a strace?
More precisely strace is the most powerful Linux tool which allows monitoring, diagnostic and instruction processes. Also, it helps to debugging and troubleshooting programs.
If source code is not available, strace helps to analyze how the program or tool interacts with the system to debug the executing of a program. Strace provides the name of each system call along with its along enclosed in parenthesis and its return value to standard error.
Requirements
Linux server with installed Ubuntu operating system.
1. Installation of a strace
Connect to the server via SSH and enter this command:
apt-get install strace
2. Usage of strace
The second command output provides all strace recorded logs:
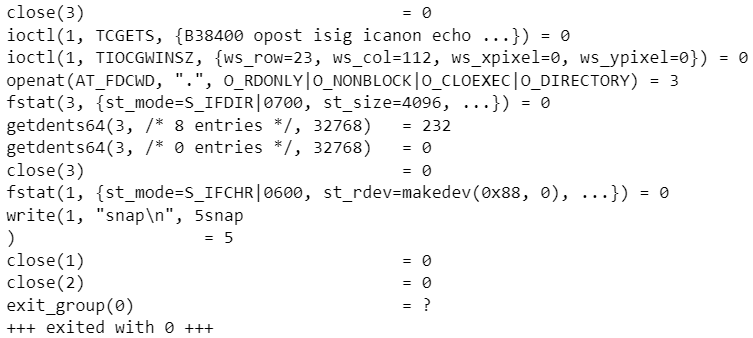
strace ls
down below is provided an example of the command output (not full):
3. Strace logs filtering by parameters
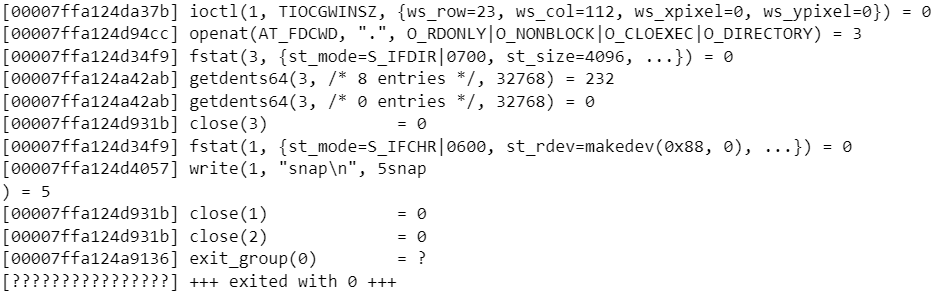
3.1 -i
As you can see, the output provides quite difficult readable information. So this command will help to filter logs according to the chosen parameter. For example, -i, will arrange entries by instruction tags:
strace -i ls
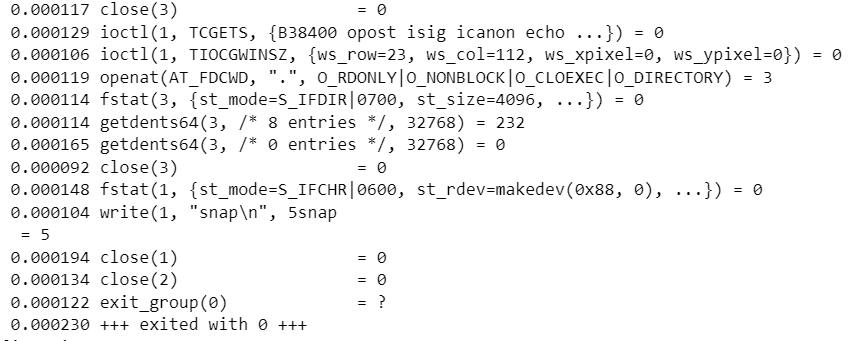
3.2 -r
Another command will strace command will allow displaying a relative timestamp upon entry to each system call. This command records the time difference between the beginning of successive system calls:
strace -r ls
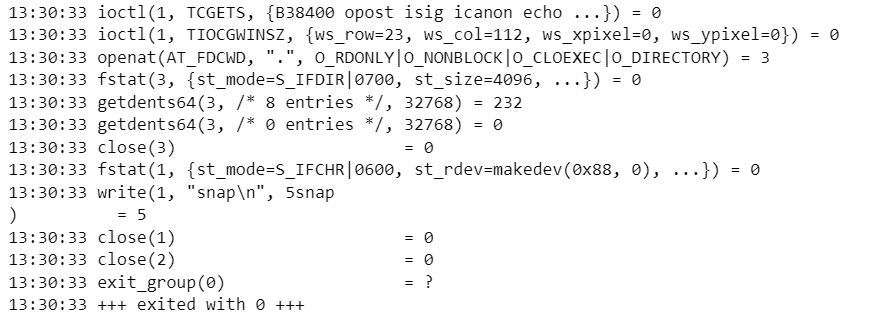
3.3 -t
The third command allows filtering logs by the time:
strace -t ls
Also, there are additional time parameter commands:
- -tt - the time will be displayed in microseconds;
- -ttt - the time will be displayed in microseconds and the main part will be displayed as a number of seconds from the epoch.
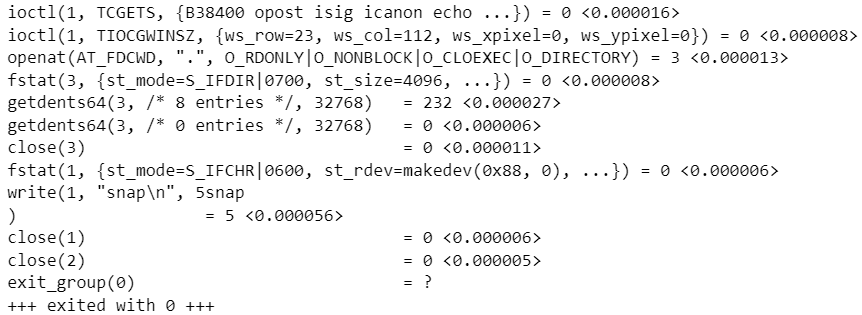
3.4 -T
Down below provided command shows time spent in system calls:
strace -T ls
3.5 -c
If you want to produce a summary:
strace -c ls
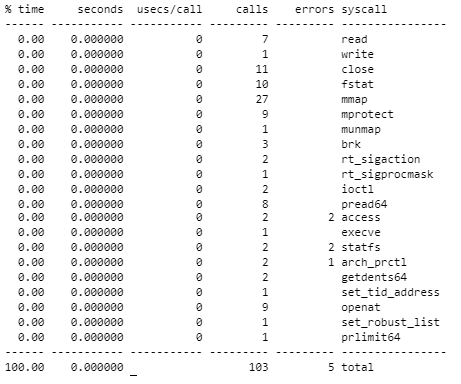
So you can see the summary gives you an idea about how many calls were made per syscall as well as time-related information for each syscall.
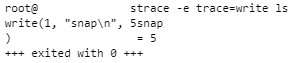
3.6 write
If you want to find the specific query, you can use this command:
strace -e trace=write ls
The value write in a particular case looks for the processes during which the information was written.
How to activate the program together with strace?
If you see that the program run incorrectly, you can activate strace with the program. So for that, you can see this command:
strace -Ff -tt <program> <request-type> 2>&1 | tee strace-<program>.log
More information about strace, you can find on the official page.
foot
Feel free to join our constantly expanding community, participate in discussions, strengthen your knowledge on Linux and Windows server management!
© 2013 - 2025 Time4VPS. All rights reserved.